14. Basic Reports
You can create and manage basic reports in Motadata. These are the simple reports that show the statistics of the counter for a given monitor in a given time range. For example: you can see the percentage of packet loss in a SNMP Device in a given time frame.
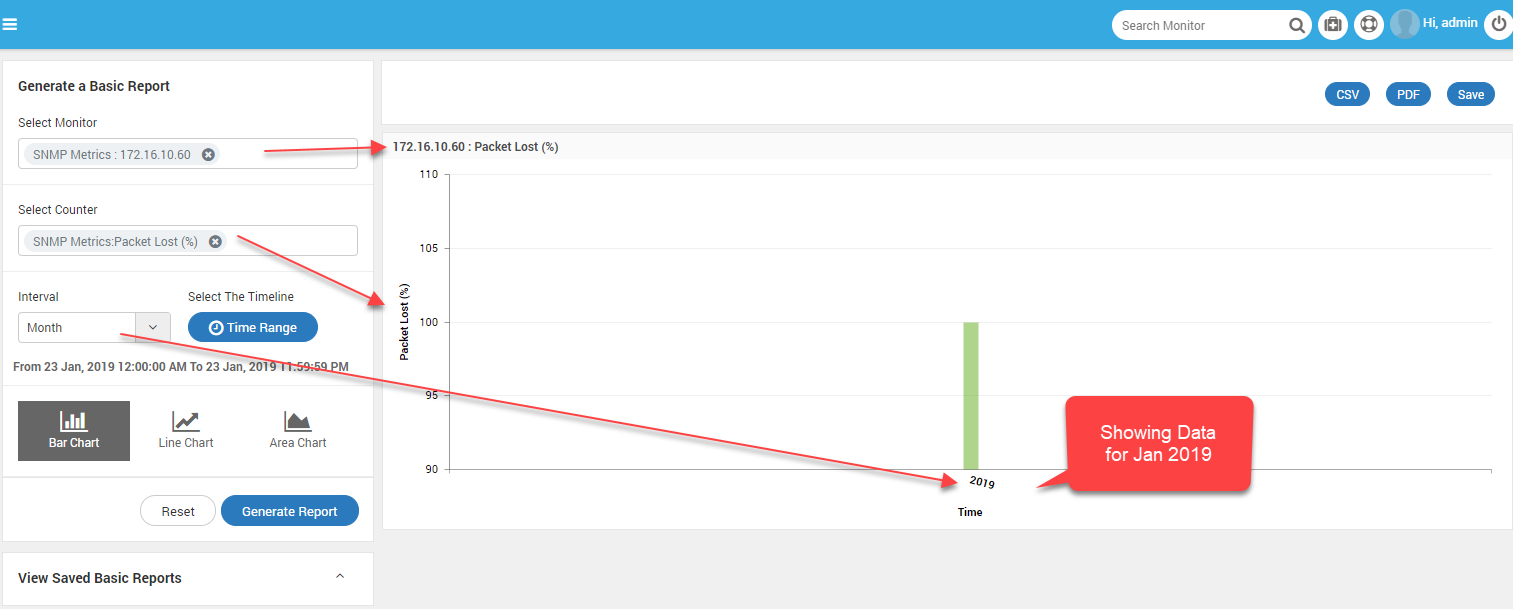
Report Showing Packet Loss Percent in selected SNMP device for 1 month
If you select multiple monitors and/or multiple counters, the Motadata will do a combination of all counters with monitors. If there is data available for the combination, Motadata will display it as a report. When there is no data in a combination, Motadata doesn’t display graph for it.
14.1. Key Features
There are 3 views available for creating a Basic Report:
Bar Chart
Line Chart
Area Chart
The reports are available in CSV and PDF formats.
You can select the timeframe for data range.
You can send the reports as email through Scheduler.
14.2. Create Report
Screen Layout of Reports
Select the fields in ‘Generate a basic Report’ menu and click on create.
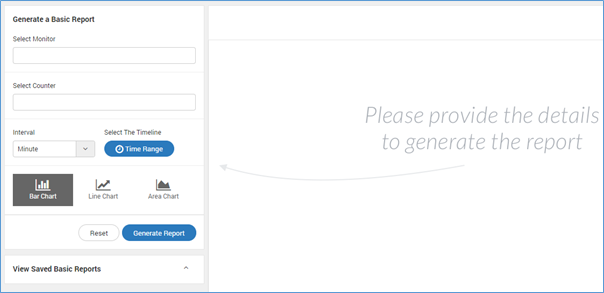
Generate a Basic Report
Select Monitor |
Select from the list of monitors for which you want to see the report. |
Select Counter |
Select from the list of counters. The list of counters is dependent on the selected monitors. |
Interval |
Select the interval from: ‘Minute’, ‘Hour’, ‘Day’, ‘Year’. The X-axis of graph will show this interval. |
Select the Timeline |
The graph shows the data for the timeline you select here. Keep the timeline more than the interval. |
Chart Type |
See the chart either as: ‘Bar’, ‘Line’ or ‘Area’ chart. |
You can select the timeline from given choices or you can set the custom timeline.
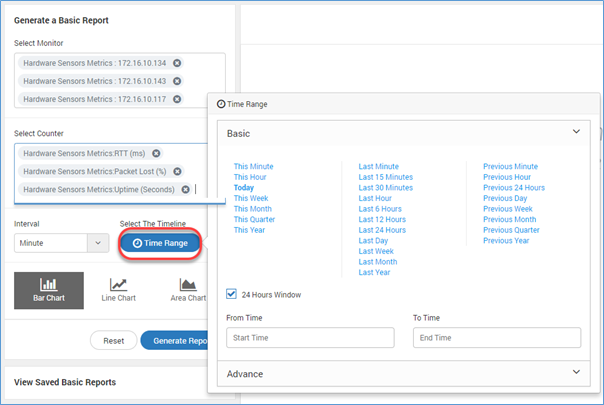
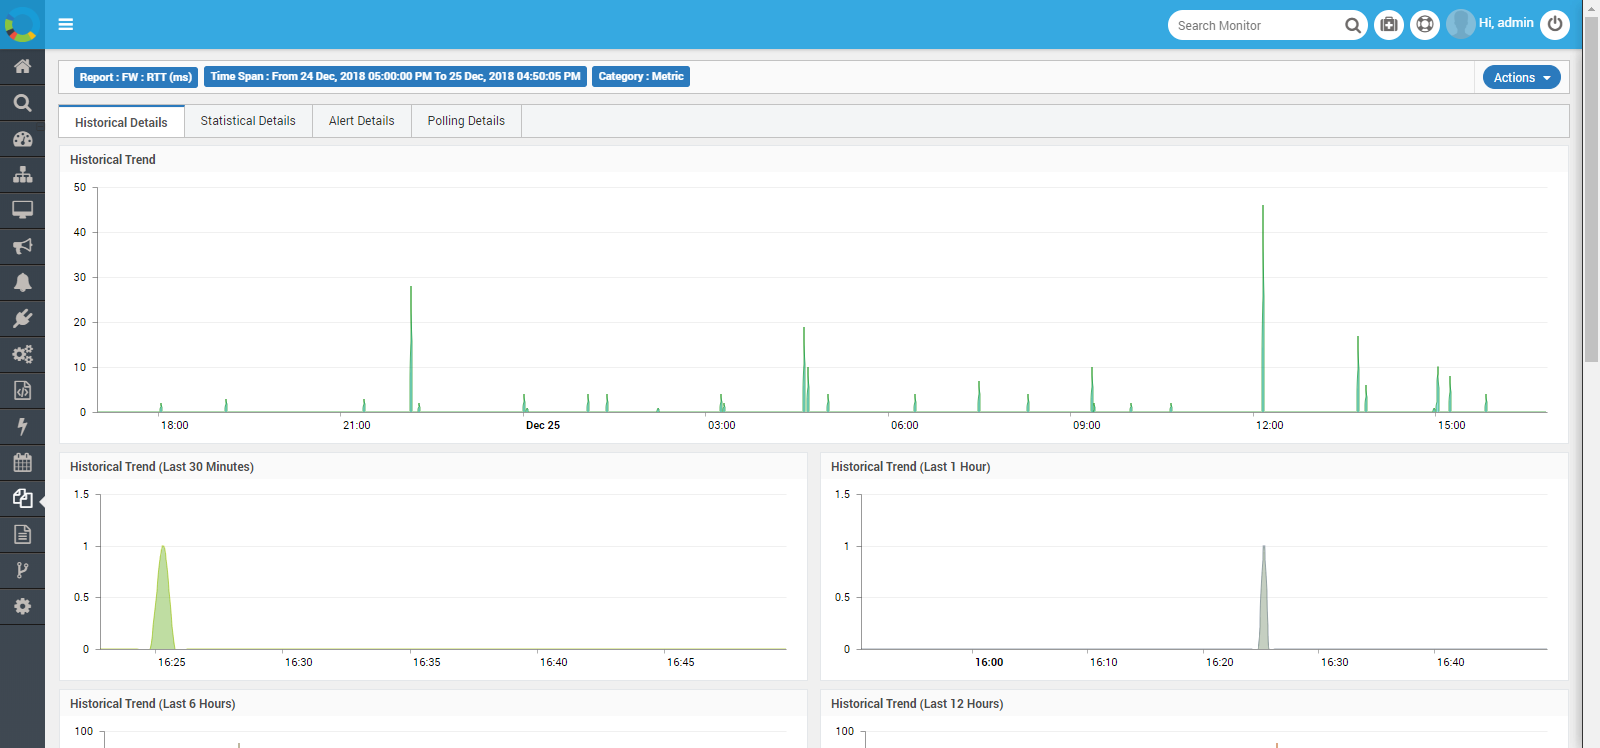
Report Timeline and Intervals
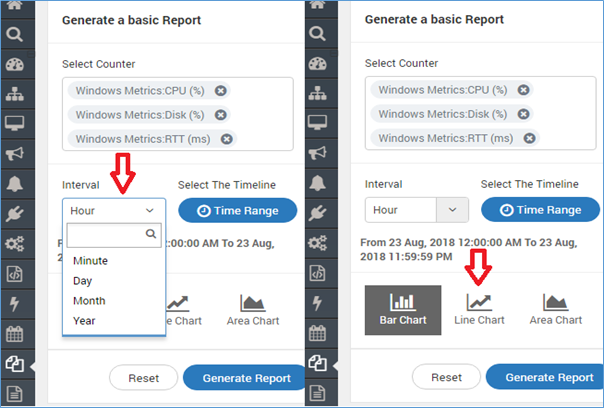
Report Interval and Graph Type
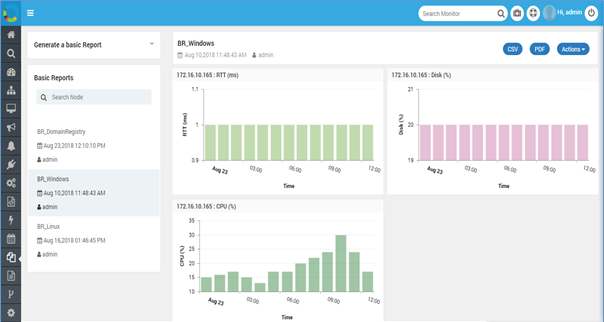
You can view the time, date, user name who created this report and available units:
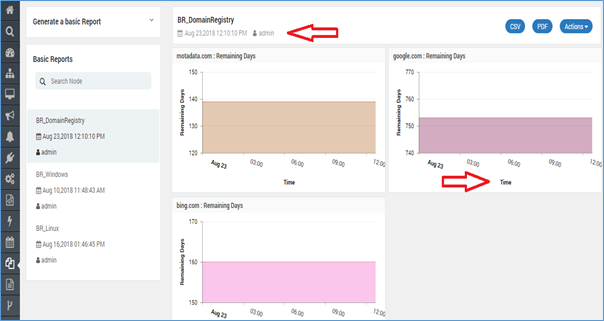
Report Demographic Details
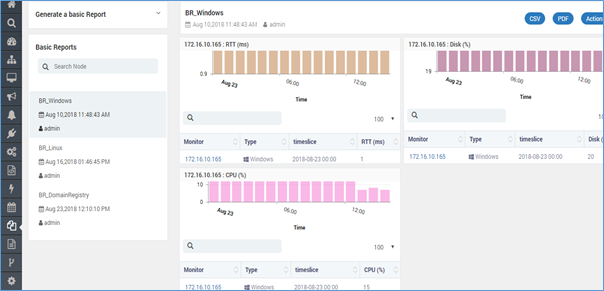
View detailed information in tabular form when you scroll down report widget where you can search by monitor IP, type etc.
Sample Basic Report
14.3. Save Report
Click on the save button to save the report. The saved report is visible in View Saved Basic Reports.
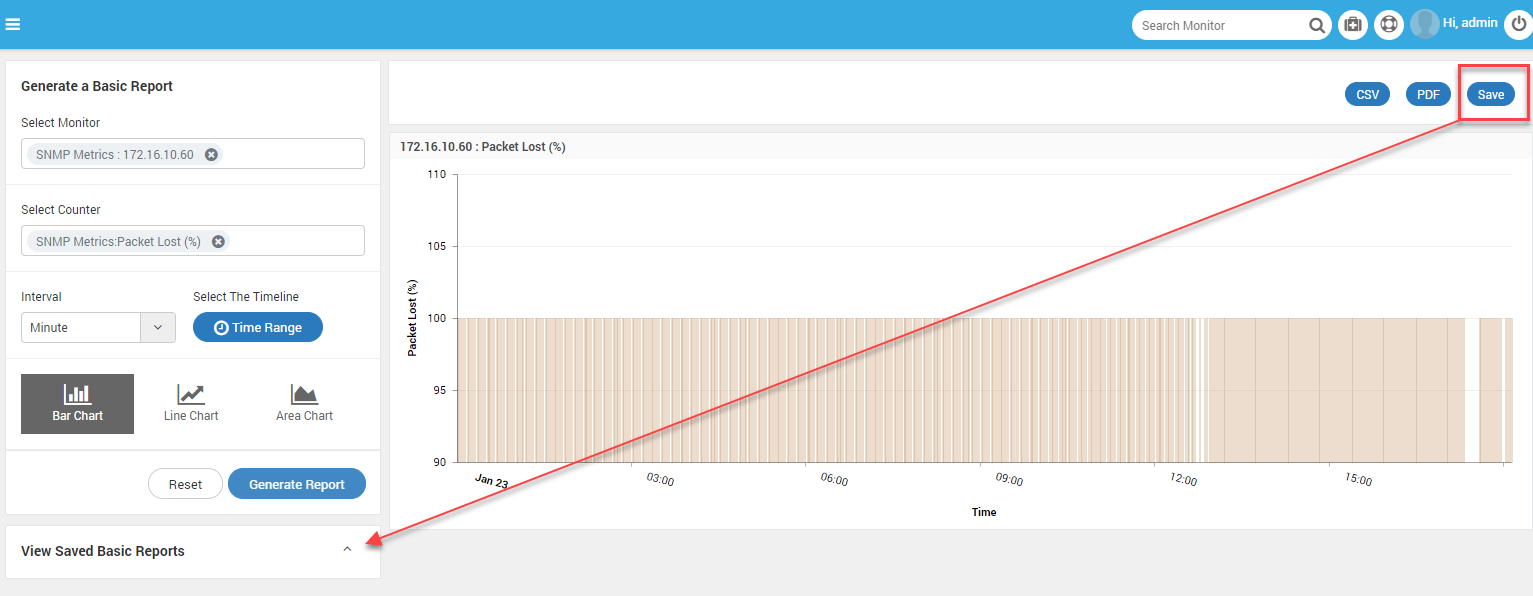
Save the Report
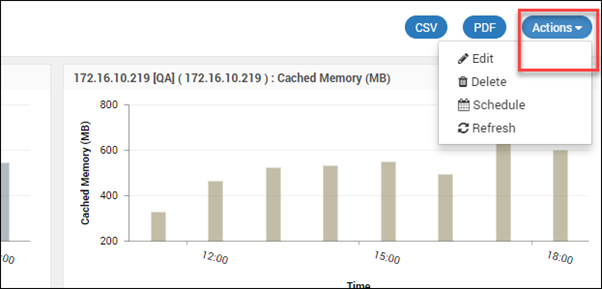
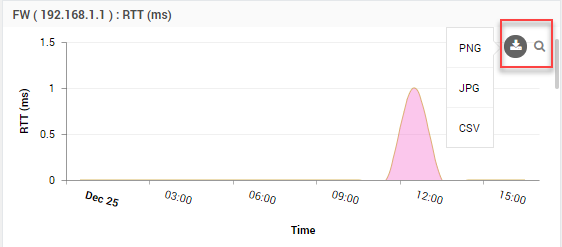
14.4. CSV and PDF
You can convert report into CSV or in PDF format by available options.
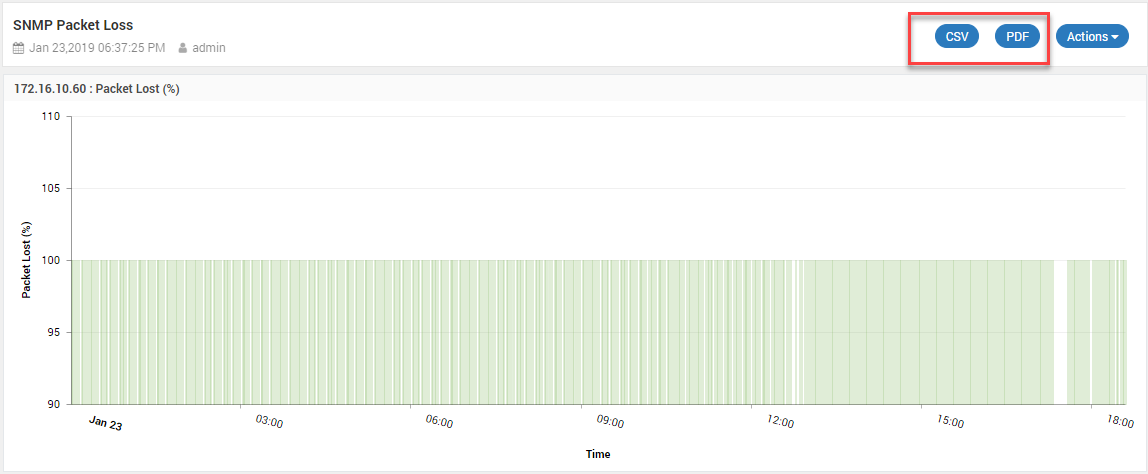
Export Report to CSV and PDF